

Does this mean a crash is coming?
A rare (and perhaps dangerous) chart pattern emerges. Is this a warning signal?
Macro strategists are sounding the alarm on a historic "speed run" that has only occurred four other times since World War II—with one notable example directly preceding the catastrophic Black Monday crash of 1987. At the same time, the artificial intelligence gold rush is fundamentally rewriting the geopolitical leaderboard, creating an extreme environment where the average stock is actually losing money while a handful of chip giants push indexes in the U.S. and Asia to record-shattering heights. This week, we are breaking down why today's record highs look eerily identical to the peak of the 2000 dot-com bubble, what a massive retail trading frenzy in South Korea means for international asset allocation, and how to position your portfolio for the defensive roadmap Wall Street's top firms are already quietly drawing up.
Subscribe for free to receive our FREE Retirement Calculator and Guide
Don’t Blink: The Stock Market’s Record High is Floating on a Tiny Island
The S&P 500 just closed out May at a fresh record high, but if you look under the hood, the engine is running on almost no cylinders. On the very day the index hit its peak, a microscopic 20 out of its 500 member stocks actually managed to achieve their own individual all-time highs—and nearly all of them were tied directly to artificial intelligence. If that feels eerie, it’s because it is an exact mirror image of March 2000, when just 20 stocks hit new highs at the absolute tip-top of the dot-com bubble right before it burst. While Bank of America strategists note that this speculative party isn’t completely over yet, a peak is rapidly closing in, driven by an incredibly narrow boom where a handful of semiconductor and memory chip makers like Micron, AMD, and Samsung are doing all the heavy lifting.
The “so what” for your portfolio is that this extreme concentration makes the entire market incredibly fragile. A healthy bull market requires a broad crowd of stocks to move upward together, but right now, the advance-decline lines—which measure gaining stocks against losing ones—have been flashing bearish signals since mid-April. In fact, as of late May, only about 55% of S&P 500 companies were even trading above their 200-day moving average. Tech-heavy indexes like the Nasdaq Composite might look unstoppable after gaining 25% across April and May for their best two-month stretch in over two decades, but history shows that this kind of hyper-narrow advance is usually the ultimate sign of underlying vulnerability.
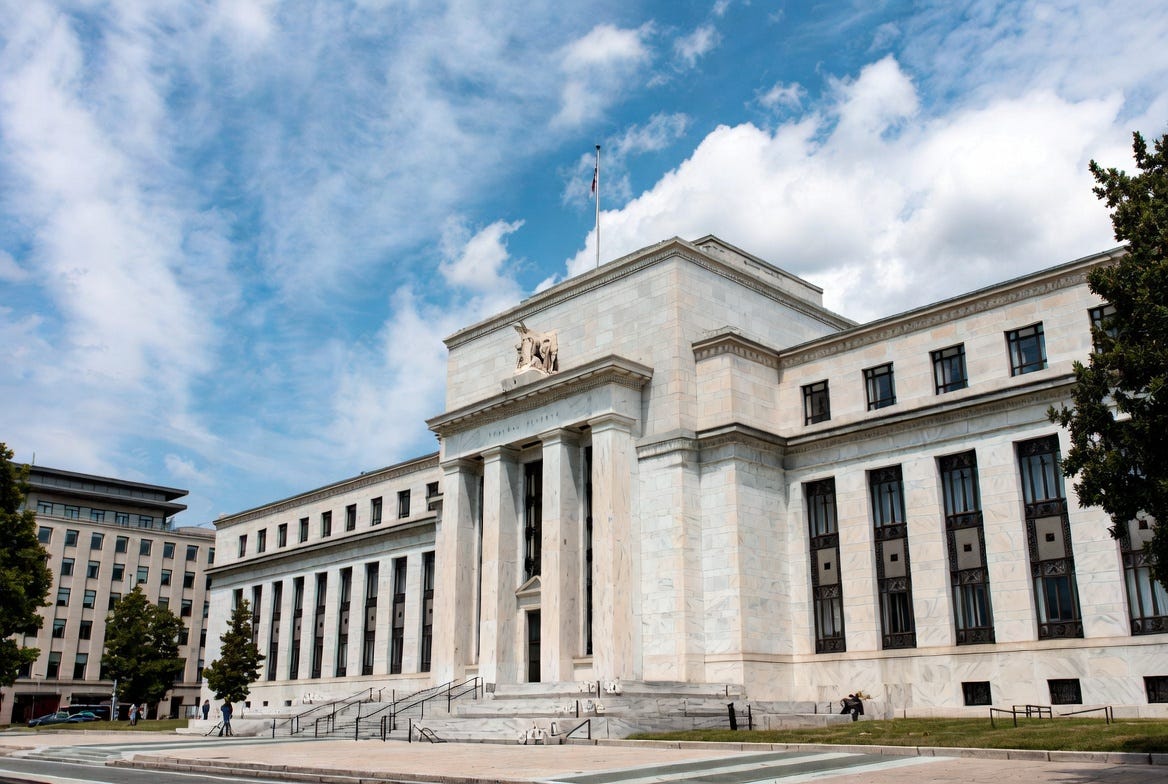
Investors are worried that the Fed might increase rates this year, which would have negative consequences for stocks.
For everyday investors trying to figure out their next move, Wall Street’s top strategists are already drawing up the escape route. Bank of America is advising clients to prepare to pivot to a defensive stance before central banks and rising interest rates ultimately end the party. According to their historical post-bubble roadmap dating all the way back to 1929, the smartest places to park your cash when the music stops are long-term bonds, classic defensive stocks, and the specific market sectors that were ignored and dramatically underperformed during the final manic months of the bubble.
Subscribe for free to receive our FREE Retirement Calculator and Guide
History Repeating: The S&P 500’s Historic Speed Run Has a Dark Omen
The S&P 500 has completely shrugged off the geopolitical fallout from the war in Iran and lingering AI anxieties to pull off one of its strongest two-month showings in modern history. According to Deutsche Bank Research, the index surged more than 16% across April and May, a breakneck pace seen only four other times since World War II. While a massive 16% leap sounds like cause for celebration, the historical context behind this milestone is sending shivers down the spines of macro strategists.
The core concern for your wallet is the specific backdrop of this rally. Of the four past instances where stocks moved this fast, three occurred safely in the immediate aftermath of a recession—specifically bouncing back from the 1970s oil shock, the 2008 financial crisis, and the COVID-19 pandemic. The only other time the S&P 500 rose this rapidly without a recession behind it was in 1987, just months before the infamous “Black Monday” market crash. Much like today, that 1987 peak was plagued by an aggressive Federal Reserve hiking interest rates alongside widening fears about national deficits, making current market valuations look highly exposed.
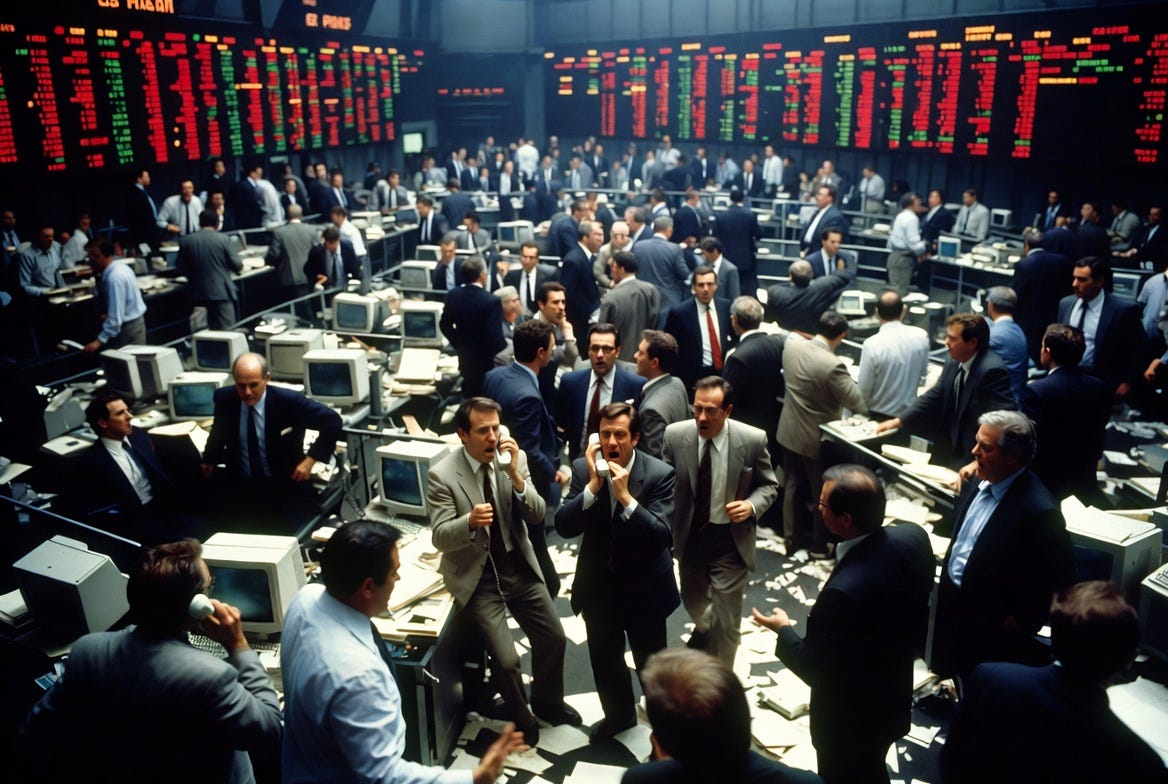
1987 was a year of high stock market speculation, leading to a massive crash when the bubble burst.
This current 11% year-to-date surge is entirely dependent on an alarmingly lopsided tech sector. Since the market hit its low on March 30 following the late-February outbreak of the U.S.-Iran war, information technology has skyrocketed over 45%, utterly trouncing the broader S&P 500’s 19.8% rebound over the same period. To illustrate just how extreme this “technology and everyone else” dynamic has become, 38 of the top 50 performing stocks since March—including all of the top 13—are from the tech sector. Consequently, the percentage of individual stocks actually outperforming the broader index over the last two months has officially collapsed to its third-lowest reading since 1972, meaning your portfolio’s safety relies entirely on a single, hyper-concentrated industry holding the line.
Subscribe for free to receive our FREE Retirement Calculator and Guide
Global Upheaval: The AI Trade Remakes the World’s Stock Market Leaderboard
The explosive demand for artificial intelligence isn’t just a Wall Street story anymore—it is actively transforming global economics and rewriting the world stock-market order. While the U.S. chip sector has been on an absolute tear since March, with the PHLX Semiconductor Index surging over 70% and names like Micron and SanDisk more than doubling, the true epicenter of this mania is in emerging markets. Driven entirely by the semiconductor boom, the South Korean stock market has expanded so rapidly that it has jumped from the 11th-largest stock market in the world to the fifth-largest since the start of the year, while neighboring Taiwan’s index has leaped from ninth to sixth.
To understand just how incredibly distorted this global rally has become, you only have to look at South Korea’s benchmark Kospi index, which is up over 100% year to date. In May alone, the Kospi gained roughly 28.5%—more than five times the S&P 500’s 5.2% return over the same period. Yet, the shocking truth is that the average South Korean stock actually lost 10.5% in May. The entire market’s stratospheric growth is being manufactured by just two AI-adjacent companies, Samsung Electronics and SK Hynix, which have seen their share prices skyrocket 191% and 263% year to date, respectively. Their growth has completely overshadowed the rest of the nation’s economy, with their combined value now commanding more than 50% of the entire country’s stock market capitalization while local healthcare and consumer sectors sit in the red for the year.
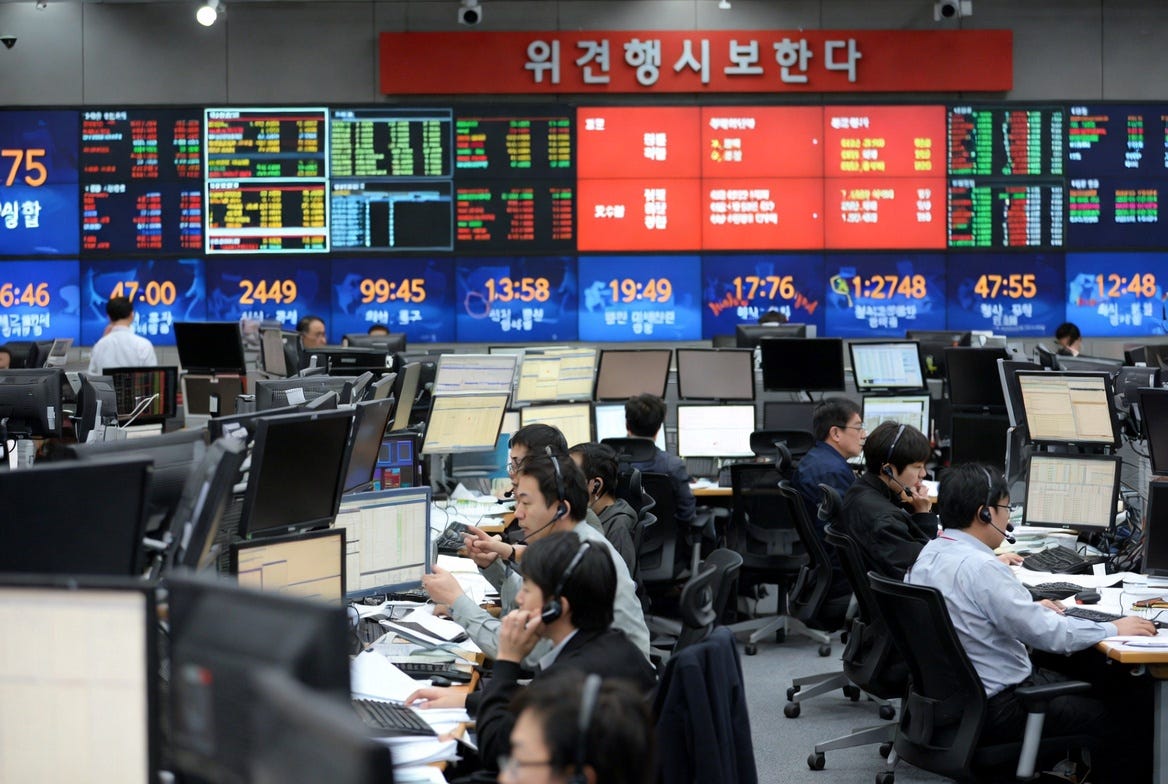
The South Korean Index (Kospi) went up by 28.5% in May while the average South Korean stock lost 10.5% of its value in May
For your portfolio and the broader global economy, the critical question is whether this international momentum is a dangerous bubble or a solid bet. South Korea’s hyper-aggressive demographic of retail investors has been heavily chasing this rally with massive debt and leveraged ETFs, driven by an intense fear of missing out (FOMO). However, unlike the “meme stock” crazes of the past, seasoned market analysts note that the underlying business fundamentals are actually matching the hype; Samsung’s quarterly revenue just grew a massive 43% sequentially to $88.4 billion, and because South Korean stocks traditionally trade at lower valuation multiples than U.S. tech companies, giants like Samsung are boasting lower forward P/E ratios than American peers like Micron. Wall Street giants like JPMorgan and Goldman Sachs are already raising their targets for the region, signaling that this massive international rotation toward specialized chip manufacturing hubs is a fundamental turning point that investors can no longer ignore.
Subscribe for free to receive our FREE Retirement Calculator and Guide
Disclaimer:
The information provided by The Market Dispatch is for educational and informational purposes only and should not be construed as financial, legal, or investment advice.
The Market Dispatch, its authors, and contributors are not financial advisors, brokers, or attorneys. Any opinions, analyses, or projections expressed are solely those of the authors and do not constitute specific recommendations for any individual.
Investing involves risk, including the potential loss of principal and capital. Past performance does not guarantee future results. Before making any financial decisions or investments, you should consult with a qualified financial advisor or other professional who understands your personal circumstances.
By reading this newsletter or using any related materials, you acknowledge and agree that The Market Dispatch and its team will not be held liable for any loss, damage, or expense incurred as a result of reliance on the information provided.
A chart pattern alone rarely causes a crash.
The bigger question is whether liquidity, credit, and financial conditions are confirming the warning or contradicting it.
I think the bigger question is when, because it seems that every time things are going sideways, the market just pops back up in 2-3 weeks. Just take a look at the Iran war which is still going on, but we’re hitting new ATHs.