

If you tune in to any financial news program during a period of market turbulence, you are almost guaranteed to hear commentators discussing “the yield curve” in hushed, urgent tones. They speak about it as if it were a crystal ball or a dark omen hanging over the market. When it “flips” or inverts, dramatic headlines flash across screens, fund managers adjust their portfolios, and talk of an impending economic downturn begins to dominate the news cycle.
To the average person, this sudden panic over fixed-income jargon can feel completely disconnected from daily life. Why does a structural shift in the bond market send ripples of anxiety through corporate boardrooms and main streets alike? What actually is the yield curve, why does it invert, and why should anyone outside of institutional trading desks care?
You do not need a Ph.D. in economics or a Bloomberg terminal sitting on your kitchen table to make sense of what is happening. Strip away the intimidating jargon, and the yield curve is really just a simple graph that reflects human behavior, investor expectations, and common sense about time, risk, and money. Let’s walk through the inverted yield curve explained in practical terms so you can confidently filter out the media drama the next time Wall Street starts to panic.
Subscribe for free to receive our FREE Retirement Calculator and Guide
The Basics: How the Bond Market Normally Functions
To grasp why a flipped curve causes anxiety, we first need to look at how the financial world operates under normal, healthy conditions.
Imagine a scenario where a neighbor asks to borrow $1,000 from you until next Friday. Because the time frame is extremely short, the odds of something catastrophic happening to your money before next week are low. You might ask for a tiny bit of interest, or hand it over as a neighborly favor, knowing your cash will be back in your hands in days. Your risk is minimal, and your flexibility is barely disrupted.
Now imagine that same neighbor asks to borrow $1,000, but promises to pay you back thirty years from today. Suddenly, the mental calculation changes entirely. Unpredictability can unfold across three decades. Inflation could erode the purchasing power of your money, or your own financial needs might change. To comfortably commit your hard-earned cash for thirty years, you will demand a significantly higher interest rate to compensate you for taking on long-term risk and surrendering your flexibility.
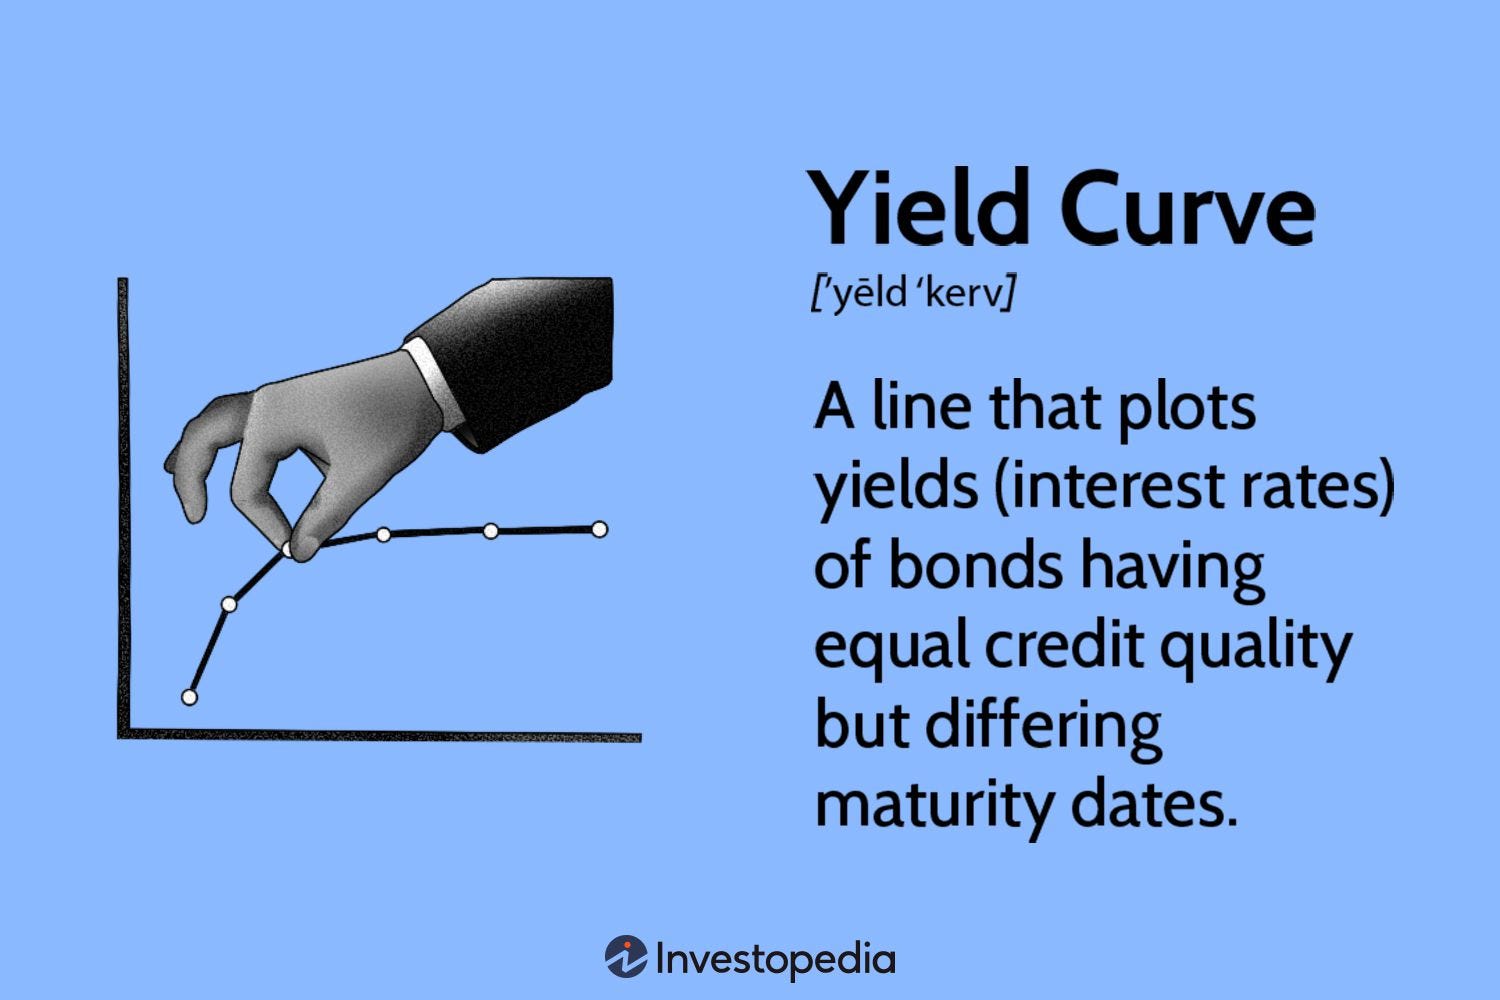
The definition of the Yield Curve (Source: Investopedia)
The bond market operates on this exact same intuitive principle. The yield curve is a line graph that plots interest rates (or “yields”) offered by U.S. government bonds across various time horizons, stretching from short-term loans like three-month Treasury bills up to long-term ten-year and thirty-year bonds.
In a healthy economy, this line slopes steadily upward. Short-term bonds offer lower interest rates because the immediate future is predictable. Long-term bonds offer higher interest rates to reward investors for locking away capital over extended horizons. Economists refer to this pattern as a “normal” yield curve.
The Inversion: When the Curve Flips Upside Down
An inverted yield curve occurs when this traditional relationship is completely turned on its head. Instead of earning higher returns for committing your money long-term, short-term bonds start paying higher interest rates than long-term bonds.
For example, you might observe a two-year Treasury bond offering an interest rate of 5%, while a ten-year Treasury bond pays only 3.8%.
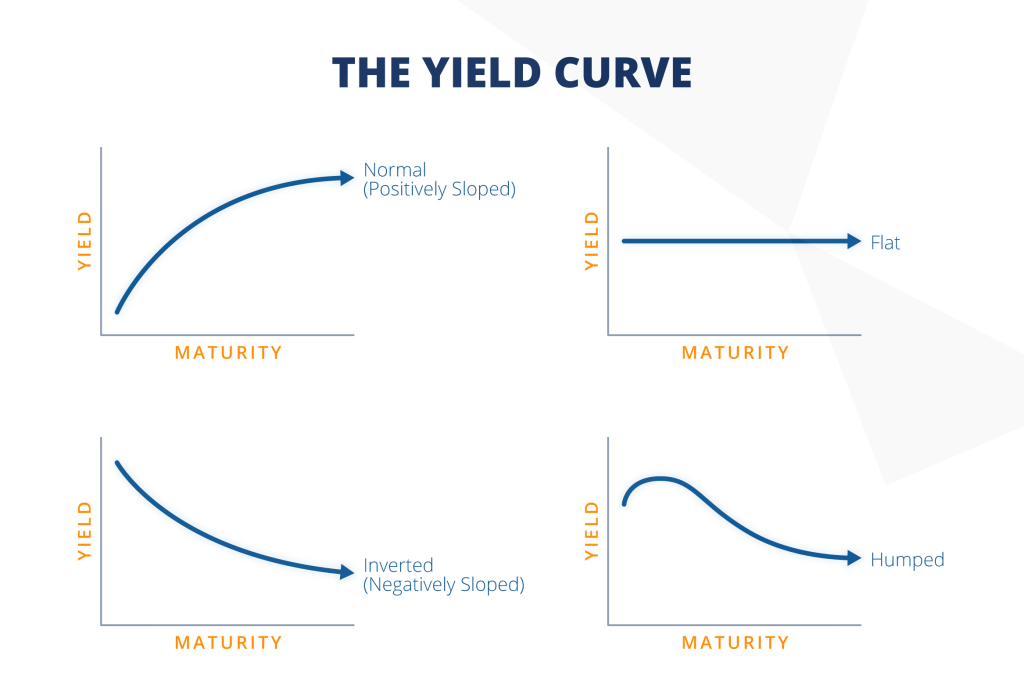
The Yield Curve under different scenarios (Source: Financial Edge)
On the surface, this sounds completely illogical. Why would any rational investor accept a lower annual return to lock up money for ten full years when they could secure a higher return for just twenty-four months?
The answer boils down to collective investor expectations about the future. When institutional investors actively buy ten-year bonds at lower yields, they are signaling a widespread belief that the broader economy is heading toward a slowdown or a recession.
When major investors anticipate economic trouble, they expect the Federal Reserve will eventually cut short-term interest rates to stimulate economic activity. If investors believe interest rates will be slashed to 1% or 2% three years from now, securing a guaranteed 3.8% return for a decade looks like a smart shelter—even if short-term rates are temporarily higher today.
As investors scramble to lock in those long-term yields while available, heavy buying pressure pushes long-term bond prices up. Because bond yields move inversely to bond prices, this demand drives long-term yields down. Meanwhile, the Federal Reserve might be raising short-term interest rates to cool inflation, pulling short-term yields upward. When those two forces meet, the curve flips.
Subscribe for free to receive our FREE Retirement Calculator and Guide
Why Wall Street Freaks Out
Wall Street does not get nervous simply because a line on a chart changes direction. An inverted yield curve triggers concern because of its historical reliability as a warning system and its direct impact on commercial banking operations.
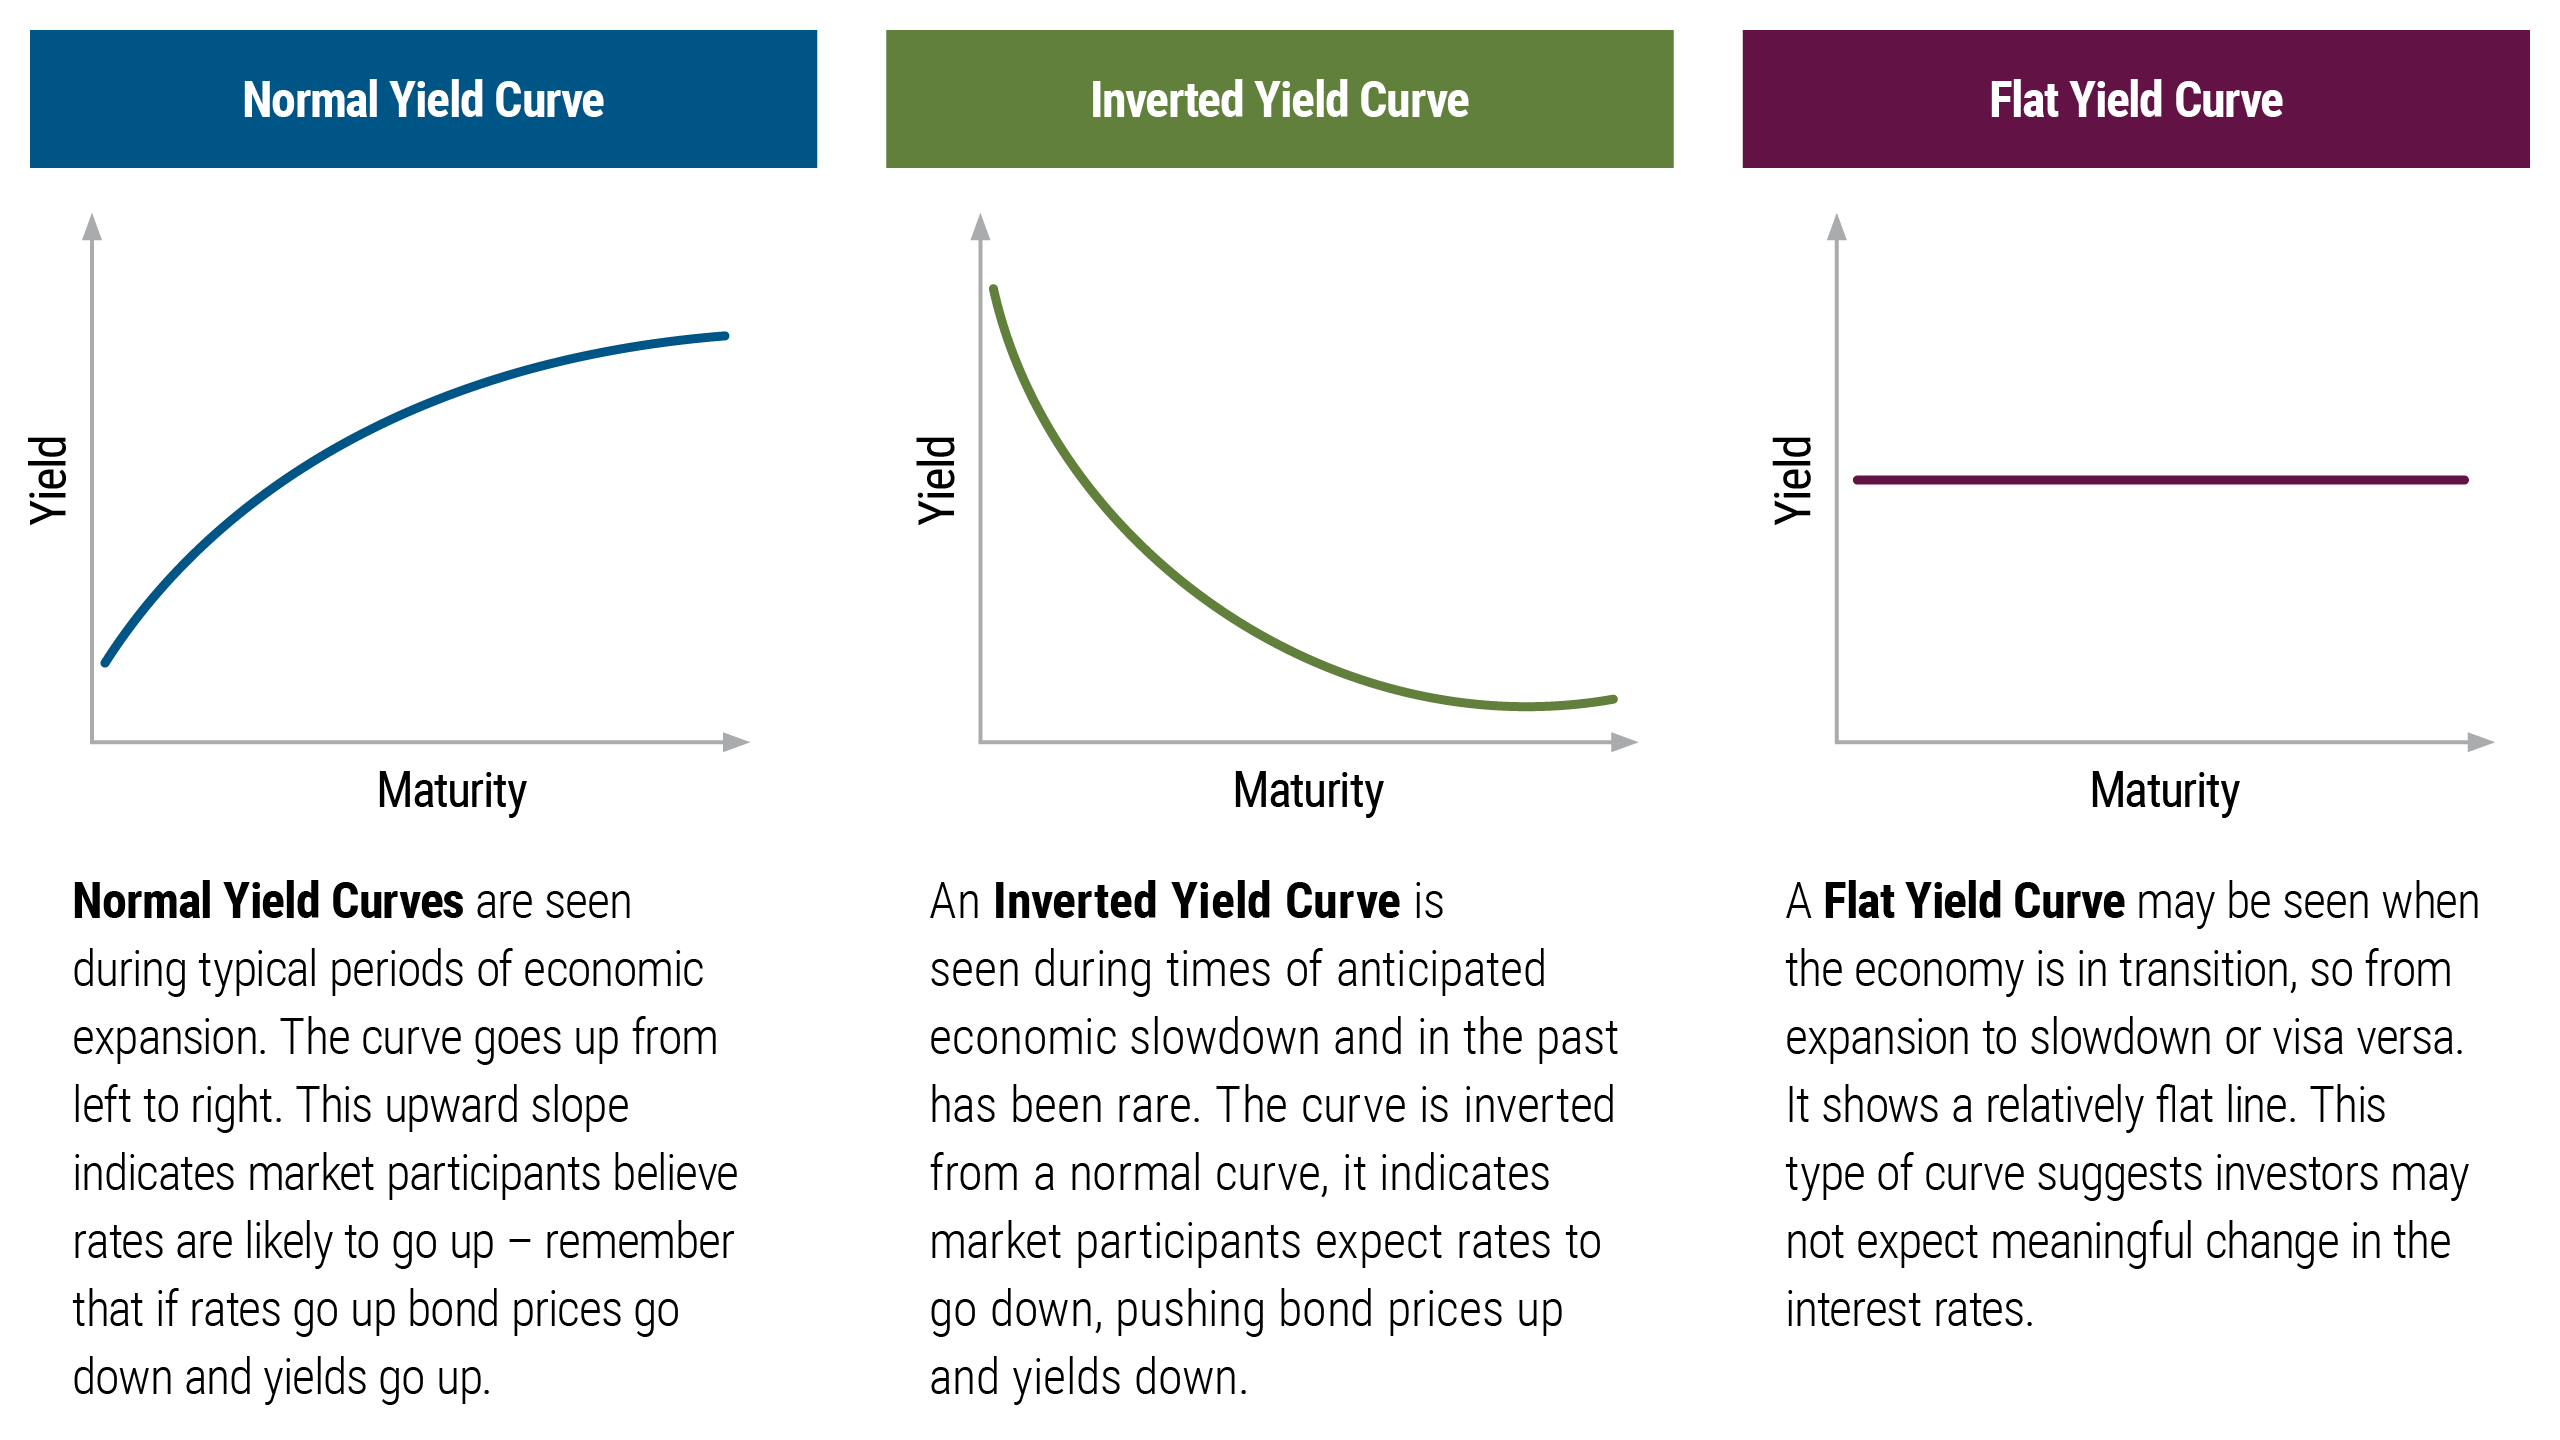
What different Yield Curve scenarios mean for the economy (Source: PIMCO)
First, the yield curve boasts a remarkably consistent track record as a recession indicator. Over the past several decades, U.S. economic recessions have consistently been preceded by an inverted yield curve. An inversion does not mean a crash will happen overnight; there is typically a lag time ranging from twelve to twenty-four months between the flip and the official start of a recession. However, because this signal has proved accurate time and time again, financial professionals take it very seriously.
Second, a flipped yield curve creates genuine mechanical problems for the banking system. Traditional banks rely on a simple business model: they borrow money short-term—paying modest interest rates on customer deposits—and lend that money long-term at higher interest rates through mortgages and business credit.
When the yield curve inverts, that fundamental profit model breaks down. The cost for banks to borrow short-term money rises above the interest rates they can charge on long-term loans. When lending becomes unprofitable or overly risky, banks tighten their guidelines, reduce credit limits, and issue fewer loans.
When access to credit dries up, economic activity slows down organically. Businesses put expansion plans on pause, hiring freezes are implemented, and household spending decelerates. In this way, an inverted yield curve is not just a passive monitor recording economic temperature; it actually helps bring about the economic cooling investors feared in the first place.
Practical Takeaways for Everyday Investors
Hearing constant news alerts about inverted yield curves can easily prompt feelings of urgency, making you feel as though you should take drastic action with your investments. However, maintaining a steady perspective is almost always the wiser path.
An inverted yield curve is a broad weather forecast, not a precise market-timing tool. Attempting to sell off investments based solely on a bond market curve can easily result in missed market gains during the lag period before any actual economic slowdown arrives.
For individual investors, an inversion should serve as a helpful prompt to review your financial foundation rather than a signal to panic. It is an ideal moment to ensure that your emergency fund is solid, your overall asset allocation aligns with your risk tolerance, and your long-term wealth strategy does not rely on short-term market timing.
At its core, the yield curve is simply the market’s way of whispering that economic conditions may become challenging down the road. You do not need to alter your long-term goals over a shift in interest rates; you simply need to make sure your financial plan remains resilient regardless of what the market brings.
Subscribe for free to receive our FREE Retirement Calculator and Guide
Follow along on social media for key updates:
Instagram: TheMarketDispatch
Disclaimer:
The information provided by The Market Dispatch is for educational and informational purposes only and should not be construed as financial, legal, or investment advice.
The Market Dispatch, its authors, and contributors are not financial advisors, brokers, or attorneys. Any opinions, analyses, or projections expressed are solely those of the authors and do not constitute specific recommendations for any individual.
Investing involves risk, including the potential loss of principal and capital. Past performance does not guarantee future results. Before making any financial decisions or investments, you should consult with a qualified financial advisor or other professional who understands your personal circumstances.
By reading this newsletter or using any related materials, you acknowledge and agree that The Market Dispatch and its team will not be held liable for any loss, damage, or expense incurred as a result of reliance on the information provided.
Really nice explanation of the yield curve, especially the distinction between a warning signal and a market-timing tool. The lag is what I find particularly interesting — knowing that a curve has inverted is one thing, but understanding what happens during the months that follow is an entirely different problem. Great breakdown.