

Three numbers landed in the same week, and they do not tell one clean story. Core inflation cooled to 3% in August, lighter than expected, and markets pushed the next Fed hike out toward December. Mortgage rates did the opposite, climbing for a sixth straight week to 7.30% and then 7.58%, the highest since late 2023, and housing demand fell to a two-year low. Underneath both, a JPMorganChase Institute study found more households moving money out of investments and straight into spending. The economy still looks warm. Financing just got expensive again. And a bigger slice of consumption now depends on the portfolio holding up.
Subscribe for free to receive our FREE Retirement Calculator and Guide
Core inflation eased to 3% in August, but the Fed’s softer print still leaves rates, wallets, and the economy in a tight spot.
The Fed’s preferred inflation gauge came in lighter than Wall Street expected. The personal consumption expenditures price index rose 0.3% in August, putting the year-over-year gain at 3.4%, versus a forecast of 3.7%. Strip out food and energy and core PCE climbed 0.2% on the month and 3% over the year, below the 3.3% economists had penciled in. That is the number officials treat as the cleaner read on longer-term price pressure. Stock futures rose and Treasury yields fell on the release, and traders marked down the odds of another rate hike in October, pushing the next expected increase out to December. New York Fed President John Williams had already cooled those October bets a day earlier, saying there is no need for urgency after September’s quarter-point hike, even while adding that another move may still be appropriate late this year.
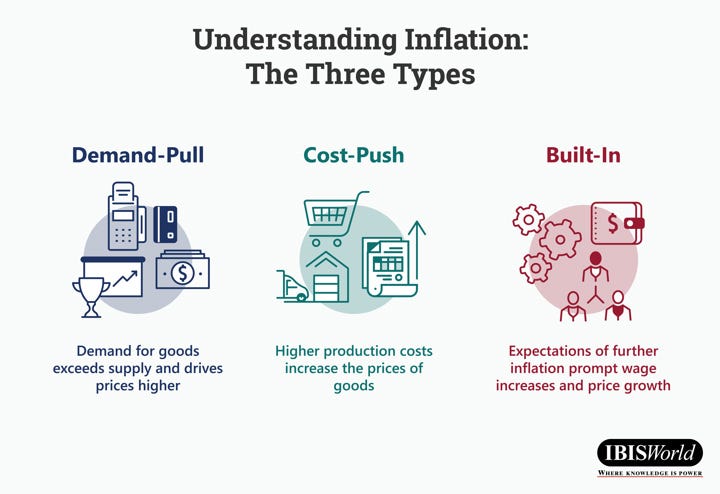
Inflation appears in different forms and it can be challenging for households and the economy as a whole (Source: IBISWorld)
The relief is real, but it is not clean. The Bureau of Economic Analysis changed how it prices legal services, software, computer accessories, and portfolio management, and those revisions alone knocked 0.36 percentage point off the July core reading. Energy did most of the lifting in August: gasoline jumped 4.4%, transportation services rose 1.4%, and energy goods and services climbed 2.3%. Goods and services each rose 0.3%. Both headline and core remain well above the Fed’s 2% target. Personal income rose only 0.2%, short of the 0.4% expected, while spending jumped 0.9%, a touch above forecasts. Separately, second-quarter GDP was revised up sharply to a 2.2% annualized pace from 1.5%, on stronger consumer spending, government spending, and investment. Real final sales to private domestic purchasers, a measure officials watch for underlying demand, rose 4.6%.
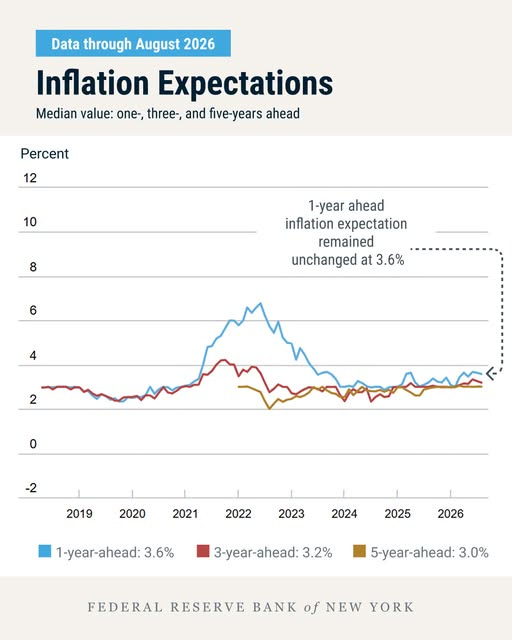
Economist closely follow the progress on inflation so the Federal Reserve can adjust rates accordingly (Source: Federal Reserve Bank of New York)
For households, the mix is challenging. A lighter inflation print takes some pressure off borrowing costs in the near term and gives markets a reason not to price an October hike. It does not mean prices are back under control, and several economists noted September is likely to look worse once diesel’s recent surge shows up. Consumers are still spending faster than their incomes are growing, which is a squeeze even if the monthly inflation number looks friendlier. The economy is running hotter than the prior GDP estimate suggested, policy is still easy relative to that heat, and the Fed is left deciding how much more restraint it needs before year-end. That is a tailwind for stocks into the fourth quarter only if the next prints do not reheat the case for December.
Subscribe for free to receive our FREE Retirement Calculator and Guide
Mortgage rates just hit a nearly three-year high, and both buyers and refinancers are backing off
The average rate on a 30-year fixed mortgage with a conforming balance of $832,750 or less rose last week to 7.30% from 7.12%, with points edging up to 0.75 from 0.73 for a loan with 20% down. That was the sixth straight weekly increase and the highest reading since November 2023. A separate daily survey put the same loan at 7.58% by Tuesday, again the highest since November 2023. Weekly mortgage demand fell 6% on a seasonally adjusted basis and is now at its lowest level in two years. Refinance applications dropped 9% for the week and were 56% below the same week a year ago. The refinance share of all applications slipped to 38.3% from 39.3%. Government refinances fell 13%, with both FHA and VA loans posting double-digit declines. Purchase applications fell 4% on the week and were 14% lower than a year earlier.
The squeeze is not only the rate. Home prices are still rising, and the pace has picked up. The S&P Cotality Case-Shiller index showed national prices up 1.9% in July from a year earlier, faster than the 1.6% annual gain in June. Buyers looking for any relief are drifting toward riskier products. Adjustable-rate mortgages, which were running about 80 basis points cheaper than fixed-rate loans, accounted for 10.3% of applications, the highest share since October 2025. Matthew Graham of Mortgage News Daily said rates moved higher again as the bond market recalibrated expectations for Fed policy, growth, and inflation. He called the move especially frustrating because oil prices dropped that day, yet mortgages had more on their mind than oil.
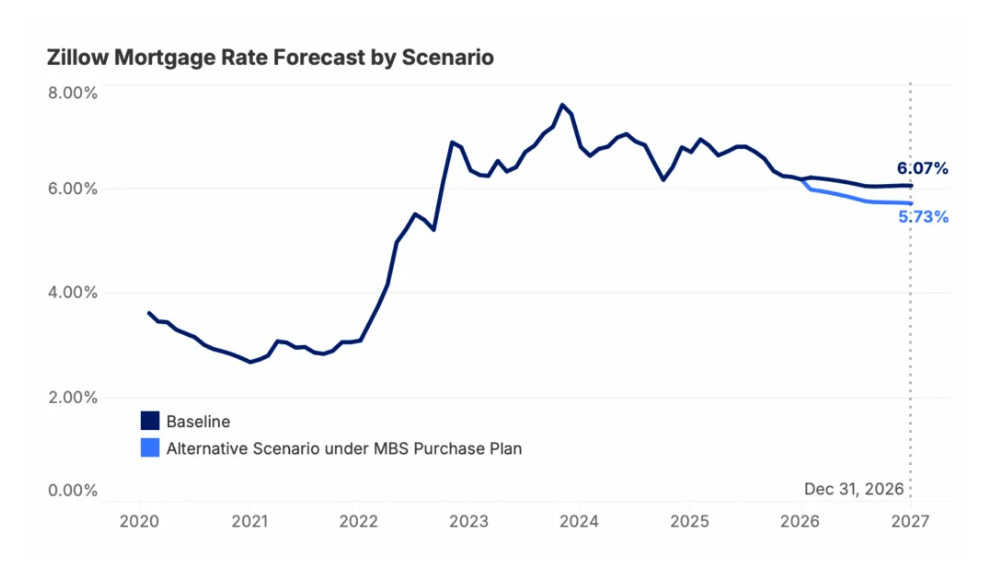
Mortgage Rates are forecasted to moderate into year end. However, consumers are skeptical and worry about a move in the opposite direction (Source: Zillow)
For anyone with a mortgage or a house hunt underway, the practical effect is simple. Almost no one with an existing loan can save money by refinancing at these levels, which is why that side of the market has collapsed versus last year. Buyers are facing a higher monthly payment and a price tag that is still climbing, so demand is thinning even as some stretch into adjustable loans to shave the rate. The housing market is cooling because financing got expensive again, not because sellers suddenly cut prices. Until bond yields stop pushing mortgage rates up, both the refinance window and the purchase pipeline stay shut for most households.
Subscribe for free to receive our FREE Retirement Calculator and Guide
More Americans are cashing out investments to pay for spending, and the economy is now more exposed to a market drop.
A larger share of households is moving money out of investments and straight into checking, then spending it. In the three months ending April 2026, 8.2% of people transferred funds from investment holdings into checking accounts, up from 4% in the same stretch of 2019 and 2.4% in 2015, according to the JPMorganChase Institute, which looked at more than 20 million de-identified Chase accounts. Those transfers equaled 6.8% of spending from those accounts, versus 3.5% in 2019 and 2.3% in 2015. The money is coming from both brokerage and retirement accounts, and it is not sitting around. Checking balances held for liquidity stayed stable, so the inflows passed through to spending.
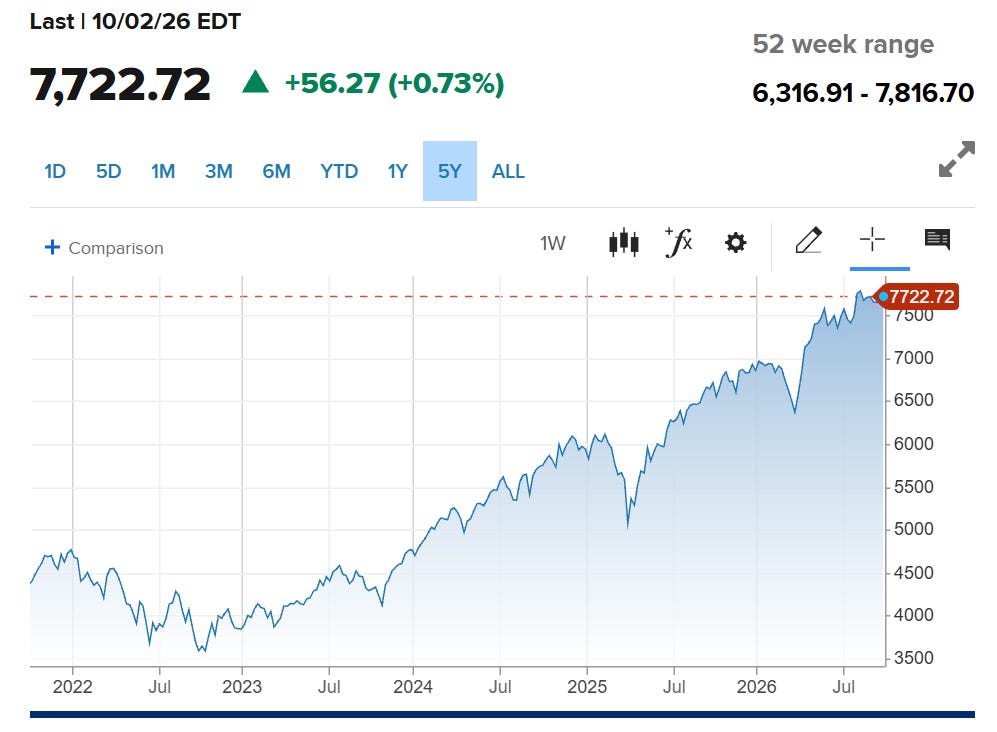
The S&P 500 index has moved from about 4,700 points in 2022 to above 7,700 points this year, which has led to great wealth gains for top earners (Source: CNBC)
Most of the flow still comes from people 65 and older and from the top 10% of incomes, but the habit has spread across every age and income group in the study. Among the top 10% by income, 20.3% made net withdrawals in the three months ending April 2026, up from 6.6% in the same period of 2015. Below the median income, the share rose to 4.1% from 1.1%. For those 65 or older in the top income group, 37.3% made net withdrawals in 2025, versus 24.5% in 2019, and those flows equaled 14.9% of that group’s spending, up from 8%. Younger households are doing it too. Among 25- to 44-year-olds with below-median incomes, 7.1% made net withdrawals in 2025, up from 2.9% in 2019. The shift also lines up with the long move away from pensions and toward 401(k)s. At the same time, more younger people are net investors: among 25- to 44-year-olds, that share rose to 16.6% in 2025 from 8.5% in 2019.
The backdrop is a long run of stock gains. After a 19.4% drop in 2022, the S&P 500 rose 24.2% in 2023, 23.3% in 2024, and 16.4% in 2025, and it was up about 12.2% this year through September 28. Stocks now account for nearly a third of household assets, roughly double their share at the start of the 2010s. Researchers call the spending link the wealth effect: portfolios look richer, so people spend more. Atlanta Fed work released September 2 found consumption has become much more sensitive to the market over three decades. The authors estimate a hypothetical 25% drop in the S&P 500 could cut consumption by about 3%. Consumer spending is roughly two-thirds of the economy. George Eckerd of the institute put the point plainly: household wealth in stocks has risen relative to the rest of the economy, so the link between markets and everyday activity is tighter. A rally supports spending. A sharp selloff now has a clearer path into the checkout line.
Subscribe for free to receive our FREE Retirement Calculator and Guide
Follow along on social media for key updates:
Instagram: TheMarketDispatch
Disclaimer:
The information provided by The Market Dispatch is for educational and informational purposes only and should not be construed as financial, legal, or investment advice.
The Market Dispatch, its authors, and contributors are not financial advisors, brokers, or attorneys. Any opinions, analyses, or projections expressed are solely those of the authors and do not constitute specific recommendations for any individual.
Investing involves risk, including the potential loss of principal and capital. Past performance does not guarantee future results. Before making any financial decisions or investments, you should consult with a qualified financial advisor or other professional who understands your personal circumstances.
By reading this newsletter or using any related materials, you acknowledge and agree that The Market Dispatch and its team will not be held liable for any loss, damage, or expense incurred as a result of reliance on the information provided.